
Histogram for Photography Beginners
Subscribe
Once again, we will dive into a photo to explore the dynamic range of a scene and the toner range captured by your camera to fully understand how the histogram is now your new best friend when you're done with episodes 11, this one, and 12.
The next one, you’ll know how to read your histogram like a pro and will never have another over or underexposed image guaranteed.
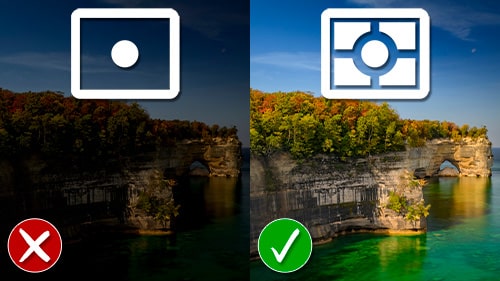
So, how do you know when you have the proper exposure?
One thing you can do is look at the image on the back of your LCD screen.
However, it will be difficult to see the image if you’re outside and it’s very bright.
Even then, if you can see the image, you may still find the image to be over or underexposed when you begin editing the file, which is going to require more editing time versus an image exposed correctly in camera, and not to mention a lower quality image at the same time.
So, the goal is to get perfect exposure in the camera to have a high-quality image.
This can be done using a built-in tool in your camera known as the histogram.
Today, I want to demystify histograms in photography to help you create exceptional, well-exposed images.
So, what is a histogram?
A histogram is nothing more than a graphical representation of data using bars of different heights.
Those bars represent the different tonal ranges or brightness levels captured by your camera.
Let’s say you go on vacation and wish to record the number of images you took each day on a graph.
On day one, you took 50 photos.
The following day, you took 150 and then 100. And on day four, you took 200.
Now, imagine your vacation was 256 days long.
Your graph would look like this, and now it’s starting to look like a photo’s histogram.
Since in photography, your photos’ histogram includes 256 bars of data.
But the real question is how these information bars help capture the proper exposure.
The answer will be apparent after you and I take a deeper dive into the histogram itself.
So, the histogram represents the pixel data of your image, depending on your camera and editing software.
This data can be presented to show information about the colors in your image and the brightness levels or the tonal range in your photo.
For simplicity’s sake, we will only cover the tonal range of a histogram in this tutorial.
As you discovered in a previous tutorial, the tonal range goes from 0% or pure black to 100% or pure white.
And everything else in between is a shade of gray.
These different shades of gray are divided into five zones, and each zone of your histogram represents an extra brightness level.
So, we will take a closer look at the histogram in relation to an image by jumping into a photo to see these zones within that image.
This will help you better understand how to read your histogram.
Alright, the very first bar of your histogram is number zero and is pure black.
The last bar is number 2 55, and it’s pure white.
So, the first and last bars are known as the Black Point and White Point.
They darken your image’s brightest parts in no detail.
So, in this image, we have a lot of blacks on the inside of this cave around here, along this railing and pathway down here, as well as behind me.
Now, as far as the white points, they’re mostly contained within the water and this mini waterfall.
Now, next to the Black Point, we have 25 more bars known as the blacks.
In essence, the blacks are a lighter shade of pure black, unlike the Black point, which contains detail and tonal range.
So, for this image, many blacks are inside the cave along the edges.
We can’t see them.
It’s hard to see right now. We would have to zoom in to see them, but we do have blacks along those areas and this area behind me.
So, the blacks are followed by what is known as the shadows, and it includes 51 bars.
Again, we have some lighter shades of black or shadows on the inside of the cave right here. We also have some of the steps here.
And then, of course, those are all shadows in different parts of the image here, here, and down here.
Next, you have your mid-tones, which include 102 bars representing a large portion of mid-gray tones.
And these can be found along the path here, along the steps.
The railing, these rocks back here, those are mid-tones, and some of the darker greens in the leaves and the trees up here.
Those are all midtones.
The next zone is known as the highlights, and it also has 51 bars, and those are located along the path here, where it’s much brighter.
Those would be highlights. We have some in the water. Some of the bricks on the bridge here are highlights and brighter leaves.
All of those would be considered highlights.
So, the final zone is known as the whites, consisting of 25 bars.
So, the whites are a darker shade of pure white, which can be found in the water here, as well as some very bright bricks on the bridge.
Now that you know what the bars represent regarding the tonal range, the next question is, why does this matter?
Previously, I mentioned that your histogram represents pixel data or brightness levels, but it’s more than that.
The pixel data itself is the detail or the texture in an image.
So, you have 256 possible bars of texture to capture along the dynamic range of a scene.
So imagine what would happen if your histogram only has 200 bars out of 2 56.
What would that mean?
That means you did not capture the detail or texture in that part of the dynamic range. Does that mean you have a terrible exposure or a bad image?
Absolutely. I mean, no.
Or is it? I need some clarification.
How about you?