
Create Perfect Exposures With Your Histogram
Subscribe
It's time to elevate your photography skills again with part two of mastering your Exposures with Histograms.
Say hello to Myrtle the Turtle, who I photographed recently. I did photograph her on a black background.
As you can see, she’s pretty dark, but she has some bright spots on her fur and eyes.
Based on the histogram, we can see the tonal range captured, which includes lots of black shadows, some mid-tones, and very little to no highlights or whites.
So, this histogram is vital to understanding them in regards to whether or not you have a proper exposure.
Let’s look at another image to explore further and understand the histogram, and you will soon realize what this histogram is telling you.
I captured This next image on a family vacation in northern Michigan.
So, let’s check out the histogram for this image. So, I captured detail in all 256 bars or the full dynamic range of the scene.
Would you agree that this image is properly exposed? Great.
The only problem is that it was a trick question since this is the histogram of the final edit.
Now, here’s the image’s histogram straight out of the camera, and it looks like many of the bars are missing in the blacks and some in the shadows.
So this is an indication that the photo is overexposed, and here’s that same image straight out of the camera with no editing, and it does look overexposed.
Wouldn’t you agree?
If I had reviewed the histogram before packing up, I could have retaken the photo to get the correct exposure.
This would’ve resulted in a higher-quality image and saved me some time editing.
It’s time for you to elevate your photographic skills with the following information.
Are you ready?
Good, because this is what’s going to separate you from every other photographer on this planet.
So here we go.
So, more than just looking at the histogram is needed.
It is only confirmation of what you see before creating your photo.
So before you click that shutter release button, you first have to visualize your final image.
What do I mean by that? Well, you must see the subject you want to capture and the light to determine your exposure.
And that simply means you have to see the light’s dynamic range or brightness levels throughout your scene.
For example, in this image, it’s very bright along the horizon and gets darker on the way up.
And then the sand here is reasonably bright, but the tree itself is darker than the sky and the sand.
So we have a shadow down here of the tree and darker areas within the tree as well.
Therefore, we have some blacks and shadows in and around the tree, sand, and sky. We have some mid-tones up here.
Then we have some highlights here inside the sand, and then we have our whites along the horizon, and then some whites and highlights on this end of the image.
So, seeing all five zones before taking the photo tells you that if you want to capture detail in the full dynamic range of your seam, you will need a histogram with bars in each tonal range.
If not, it looks like this, then you know your image is overexposed.
But if the histogram looks like this, do you know it’s underexposed?
Remember Myrtle, the turtle? She had a histogram that looked like this one, and here it is again.
But we know, based on the dynamic range of that scene, there will be more bars on the left side of the histogram and little to none on the right side.
That is why it’s essential to see the brightness levels of your scene.
So, you know what to look for in your histogram to ensure you get the exposure needed for your creative vision.
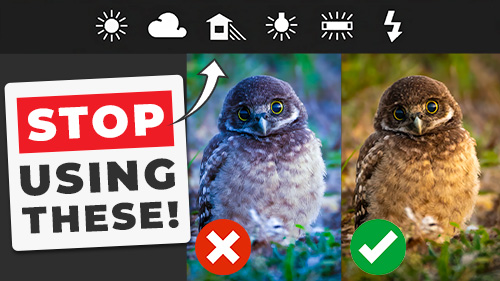
Our next image is another family member, and his name is Fuzzy Bunny.
This time, we have a primarily white bunny on an all-white background, and as you can see, fuzzy has some light gray spots, and his eyes are almost pure black.
So, picture in your mind what the histogram should look like.
Is this what you had imagined?
Excellent, because as you can see this time, the bars are heavier on the right side where the highlights and whites are, and we have some information or detail in the mid-tones and very few to none in the shadows and blocks.
So remember, the histogram will confirm what you see before you take the photo, and if the histogram matches those brightness levels, you should have a properly exposed image.
So far, we’ve explored the tonal ranges within a histogram, and you now know what to look for to confirm you have the correct exposure.
But the histogram can also warn you if the scene exceeds the dynamic range of your camera.
So remember, your camera only has seven to 14 stops of dynamic range.
Let’s look at some histograms that warn you if you’ve exceeded the dynamic range of your camera.
This will help you decide if you should be exposed to the left or the right or control the light by diffusing it or other means.
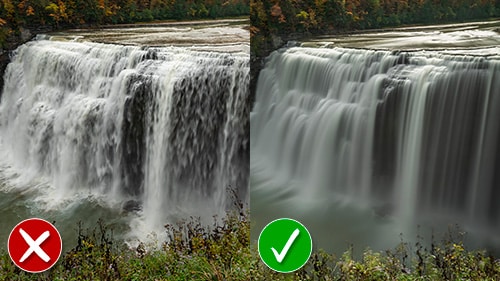
So here’s another image of Myrtle, the turtle. This image is much darker than the first one I showed you, and the histogram is even heavier on the left side versus before.
Notice how the bars are bunched up to the left side.
This is your warning that details are being clipped, or in other words, you’re losing detail in the black tones and possibly the shadows.
This would be considered an underexposed image.
What you want to do instead is this histogram.
Notice how the bars on the left side are less heavy or bunched together than in the underexposed image.
A good rule of thumb is to ensure there is little to no gap on the left and/or right sides.
And, of course, that all depends on the dynamic range of your scene.
An overexposed image will be the opposite of the last one.
So, the bars will be bunched together on the right. If you see this, adjust your camera settings until your histogram has little to no gap on the right side.
Alright, the one thing we still need to cover that you might be wondering about is the height of the bars in our vacation example.
The height of the bars changed based on how many photos were taken each day.
The bars in your photos’ histogram can also change heights based on the brightness levels.
So, you’ll see a spike for that specific tonal range if there’s a predominant brightness level.
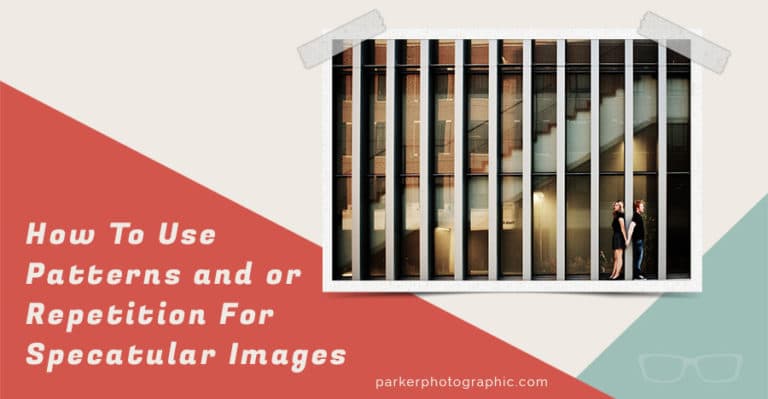
So, for this image, I photograph the couple against a dark wall, and the histogram shows a massive spike in the blacks and shadows.
This is where the majority of the background brightness levels are located.
As you can see, the mid-tone highlights and white bars also have data, but the bars are much shorter since those ranges have fewer details.
Alright, what time is it? That’s right, it’s Parker time.
No, not really.
It’s time to elevate your photographic skills by taking complete creative control over your camera and learning to shoot in full manual mode in the following photography tutorial.